
The stimulus data can be viewed as a tree. The root of the tree represents the whole country. The interior nodes in the tree represent states, cities, and categories of projects. The leaves represent specific projects.
Treemaps are a space-constrained method for visualizing hierarchical structures. Treemaps allow users to compare leaves and sub-trees even at varying depths in the tree, and spot patterns and exceptions. Ben Shneiderman designed treemaps during the 1990s as a way to visualize the contents of a file system, but they have since been used to visualize many different types of data including stock portfolios, oil production, a gene ontology, etc. A former CS121 student even used treemaps as a way to visualize the difference between two catastrophe reinsurance pricing methods. The original idea has been extended in lots of interesting ways.
In this assignment, you will write code to draw treemaps for stimulus data along with a key for interpreting result.
The treemap algorithm takes a weighted tree, where the weight of a leaf is an application specific cost and the weight of a subtree is the sum of the weights of its children, and an initial bounding rectangle as arguments. It assigns regions in the rectangle to the leaves of the tree. The size of the region (itself a rectangle) assigned to a leaf is a function of the leaf's weight and its placement is a function of its position in the tree.
Here is an example that we will use to make this concept more concrete. This tree represents a single city (Addison, Illinois). Addison has three Streets and Roads projects and one Water project.

Weighting Function:
We will use the cost of the associated project as the weight of the leaf. The cost of an interior node is just the sum of the weights of its children. In our example, "Resurfacing #1" cost $12,200,000, so the weight of that node is $12,200,000. The weight of the "Streets and Roads" node is the sum of the weights its children, that is, the three resurfacing projects ($25,845,000). Similarly, the weight of the "Install water mains" project is its cost: $4,400,000. The weight of the "Water" node is also $4,400,000, since it has only one child. And so, on.
Partitioning the initial bounding rectangle
To describe how real estate is assigned in the treemap algorithm, we will start by looking at the treemap for the "Streets and Roads" subtree from our example above.

|
|
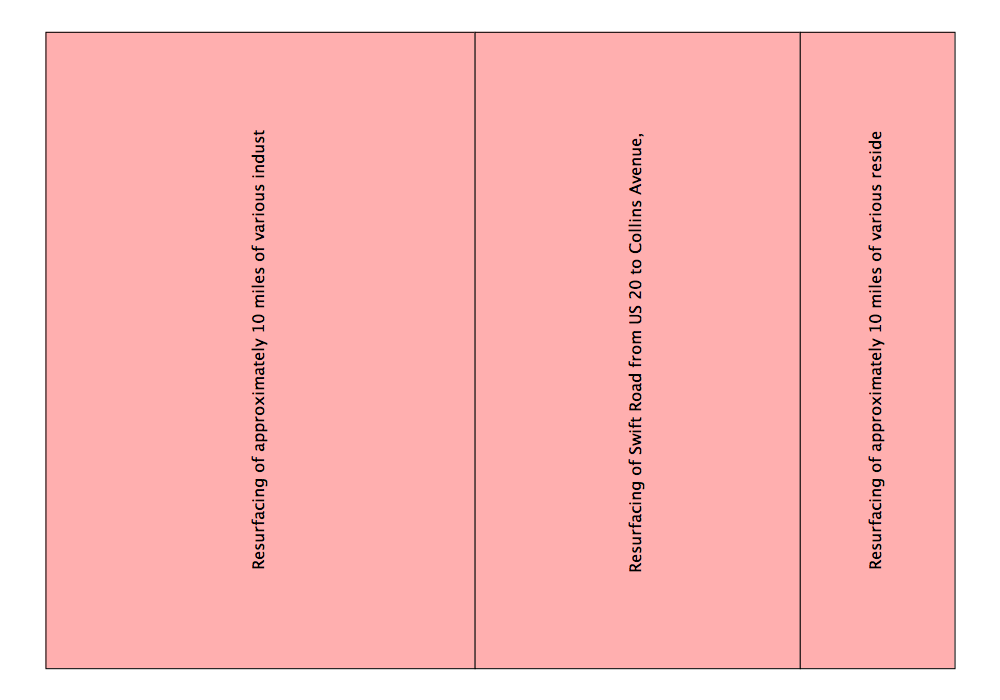
The treemap algorithm splits the initial rectangle into subrectangles, one per child of the root. The proportion of a child's subrectangle is determined by its weight as a fraction of the total weight of its parent. For example, the treemap algorithm splits the initial rectangle assigned to the "Streets and Roads" node into three pieces from left to right: 47% to "Resurfacing #1," 36% to "Resurfacing #2," and 17% to "Resurfacing #3."
Moving on to the "Addison" subtree:
|
|
|
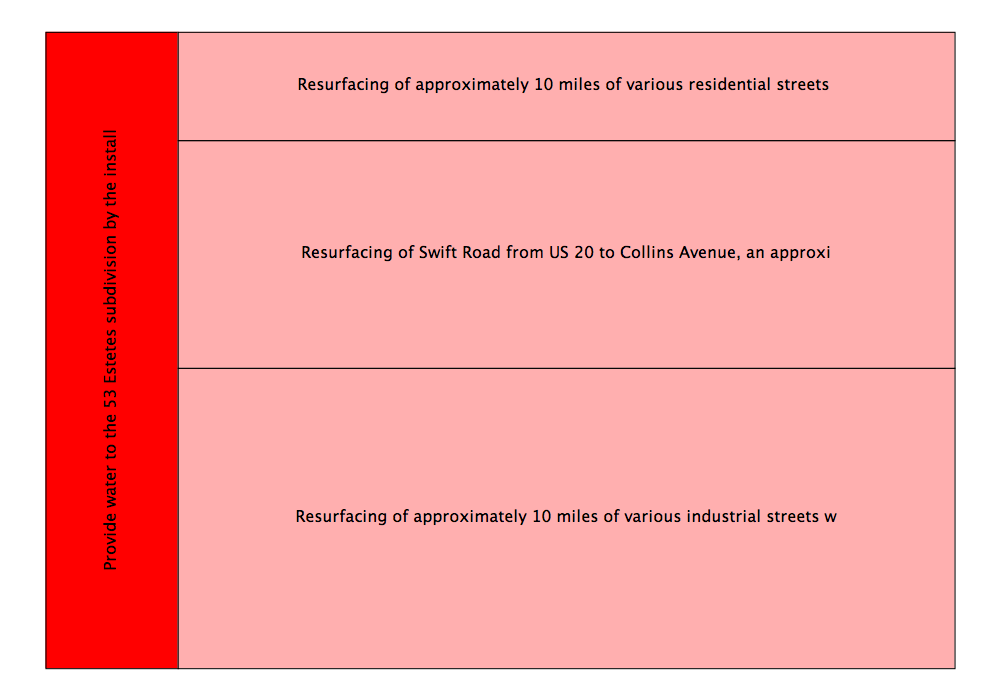
The treemap algorithm splits the initial rectangle assigned to the "Addison" node from left to right into two rectangles with 15% of the initial rectangle going to the "Water" subtree and the remaining 85% to the "Streets and Roads" subtree. The "Streets and Roads" rectangle is further subdivided as described earlier. Notice that the proportions of the "Streets and Roads" split are the same as the earlier picture and that the orientation of the rectangles has changed.
Finally, here is a tree for two cities in Illinois (Aslip and Addison):


Important detail: We will use an initial bounding rectangle with a lower left corner at (0,0), a width of 0.8, and a height of 1.0. (The units do not matter.) In case you are curious, the extra space on the right (from 0.8 to 1.0 on the x-axis) is reserved for the color key.
During the course of running the treemap algorithm, you may generate rectangles that are too small to be useful. In this case, do not split the rectangle any further. We will define a rectangle to be too small if it has a height or a width less that 0.01.
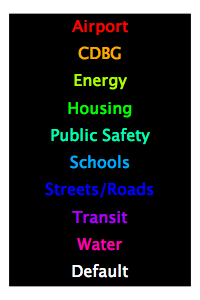
Choosing labels and colors
You will assign colors to the rectangles based on the project's program (CDBG, Streets and Roads, etc). You should use the default color for any rectangle that became too small to split. We will use the project names as labels. You should orient the labels in the rectangles left-to-right or bottom-up depending on whether the width or the height of the rectangle is larger. Do not label any rectangle that has a width (height) of less than .03. Also, the labels should be clipped (truncated) to fit within 60% of the width/height of the rectangle.
You are on your own for deciding what functions to write. We highly
recommend that you figure out what functions you need before you start
writing code and test those functions as you go.
We will be using GenDraw (API), which is a generalization of the StdDraw library provided by S&W to draw pictures. Section 1.5 of S&W contains a description of how to use StdDraw. For the purposes of this project, the main differences between GenDraw and StdDraw are that GenDraw allows you to have multiple canvases, rotate text, and clip text to fit within a certain range. The main function in Treemap.java contains code for setting up the canvas.
The file Sample.java contains
a set of simple examples that use GenDraw.
The StimulusTree constructor handles the details of dealing with parsing the stimulus data. Given the name of a file containing stimulus data it builds a tree from the data in that file. (Warning: the code to generate the tree is complicated. You DO NOT need to understand how it works. Abstraction is your friend!) In addition to the constructor, the StimulusTree class has access methods for getting labels, weights, projects, and children and for setting weights.
The StimulusTree constructor sets the initial weights to zero.
Make sure your name and CNET ID are at the top of TreeMap.java and then check your code into PhoenixForge.
We strongly recommend that you check your code into PhoenixForge at regular intervals!