Classification: dyadic partitioning
Computer Science with Applications 1 & 2
Due: Wednesday, March 18th at 5pm
The goal of this assignment is to give you experience with a binary classification technique named dyadic partitioning and with building and traversing trees, while designing and implementing a medium-sized C program.
We strongly prefer for you to do this assignment in pairs, but you may work along if you prefer. If you wish to sign up for a design meeting, please post a note on Piazza and someone will get back to you to arrange a time.
Introduction
Is a tumor benign or malignant? Is a patient at high risk for diabetes? Is a page relevant for a specific search request? Based on his voting record, is a member of Congress a Democrat or a Republican? These are all examples of binary classification problems. The goal of such problems is to classify subjects based on which of two categories best fit their attributes.
In this assignment we build a system that generates binary classifiers using dyadic partitioning.
A classification task
Here is an example binary classification task: given the data set shown below, which has points that fall in the unit square: [0.0, 1.0]x[0.0, 1.0] and are labeled with a class,

build a program that can determine whether a new point belongs to the blue (triangles) spiral or the red (circles) spiral. For example, should the black x at (0.7, 0.15) be classified as red or blue? Such a program is called a classifier.
Classification trees
A classification tree is a method for sorting data into different classes. Internal nodes in the tree are used to sort data based on a specific attribute. Leaves are used to assign classes. For example, given the tree below:

The point (0.44, 0.2) would be classified as red. Starting at the root, 0.44 <= 0.5, so we would take the left branch to node B. Continuing on from B, 0.2 <= 0.5, so we would take the left branch to node D. And so on, until we reach node L, which is labeled with the class red.
Note that traversing this tree is not guaranteed to produce the correct class. For example, the point (0.44, 0.76) belongs to the red spiral, but the tree above would classify it as blue.
Dyadic partitioning algorithm
Dyadic partitioning is a method for building a binary classifier. This method partitions the unit hypercube into a collection of hypercubes and then builds a classification tree from the partition.
Here are three different dyadic partitions of the spiral data:


The rectangles (aka a two-dimensional hypercube) shown in these pictures correspond to the leaves in the resulting classification tree. Please note that the decision tree shown above corresponds to the first partitioning.
Over-fitting (that is, producing a partition that is too specific to the training data) is one potential pitfall with this method. For example, here is a data set and two possible partitions:
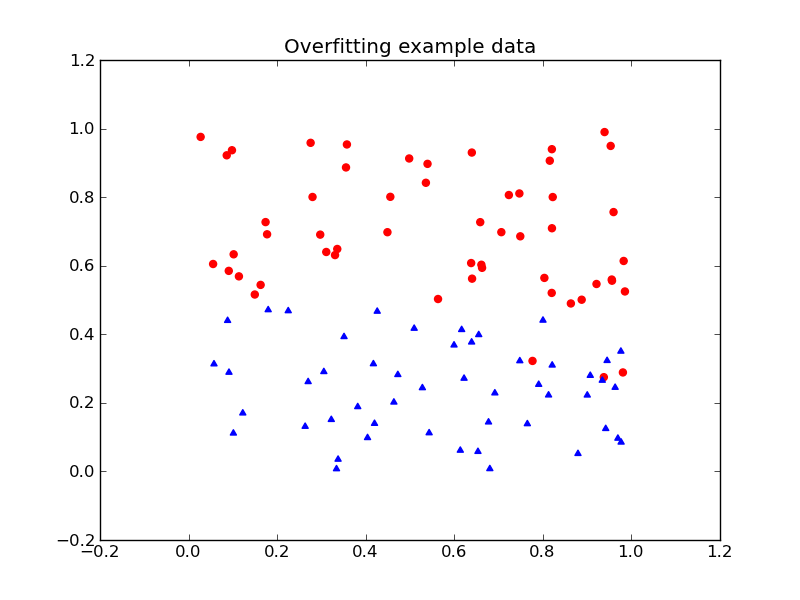
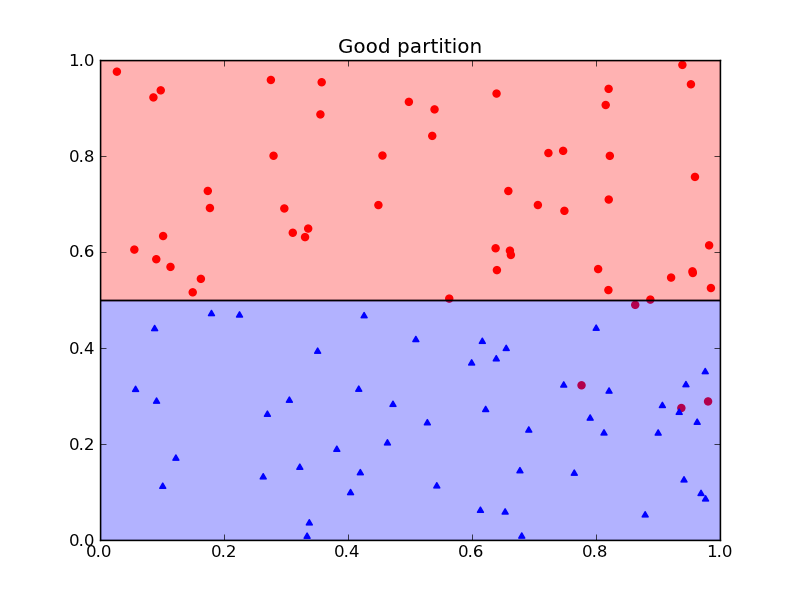
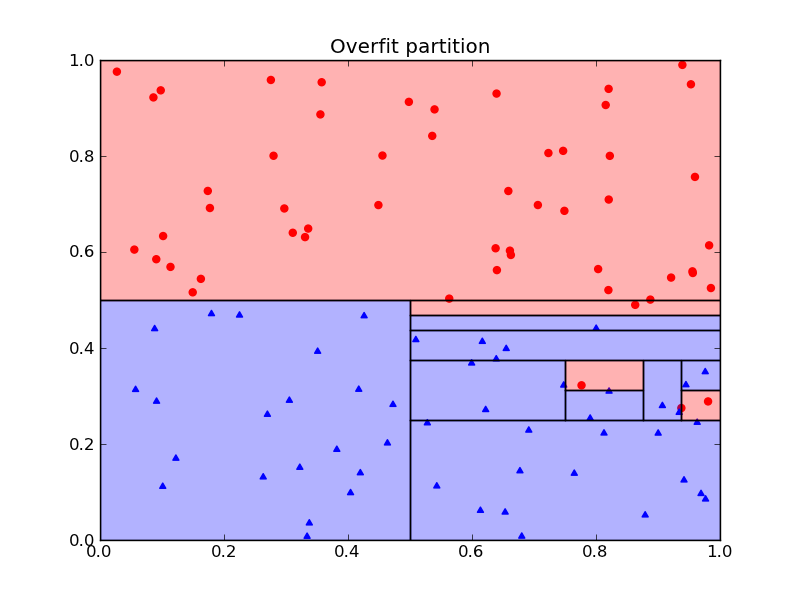
The first partition is likely a better choice than the second, more specific, partition.
To avoid over-fitting, we will impose a penalty (λ) for each leaf in the tree. We will use the majority rule for assigning classes: given the region R associated with a leaf, label it with the class that occurs most frequently among the points that lie in region R. The error of region R (and its corresponding leaf) is defined to be the number of points in the region that are misclassified.
You will be implementing a two-dimensional version of this algorithm. It works as follows: given a rectangle, R, and a set of data, S, that lies within the rectangle, compute the cost of:
- declaring R to be a leaf,
- splitting R vertically into two regions, left(R) and right(R) and recursively partitioning the resulting rectangles or
- splitting R horizontally into two regions, top(R) and bottom(R) and recursively splitting the resulting rectangles.
and then choose the option with the lowest cost. Given this explanation, we can define the cost function recursively:
cost(R) = min(error(R) + λ, cost(left(R))+cost(right(R)), cost(top(R))+cost(bottom(R)).
Ties should be broken as follows: leaves have precedence over either type of split and a left-right split has precedence over a top-bottom split.
To reduce the cost of the computation and to avoid over-fitting, your implementation should limit the depth of the partition (and by extension the height of the resulting tree) using a level parameter.
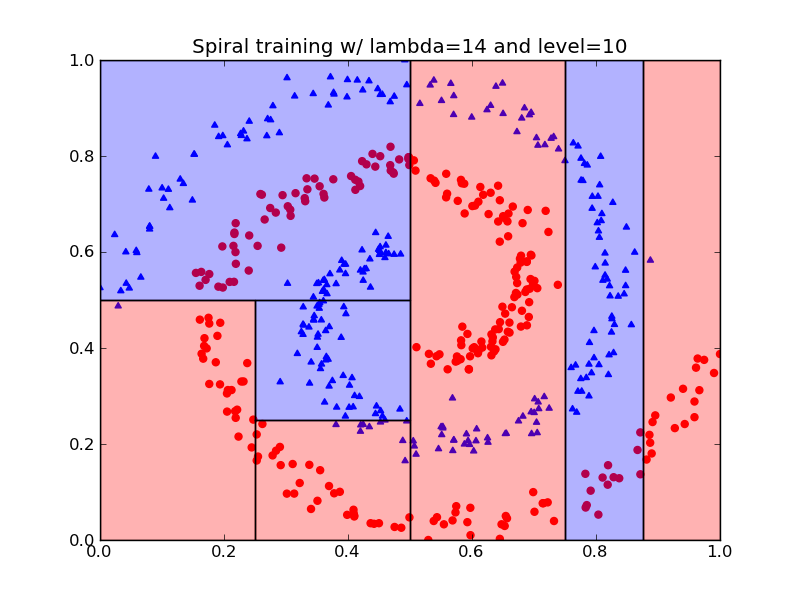
The final result of this algorithm is a tree in which each node is labeled as a leaf, an interior node for which the children were split left-to-right, or an interior node for which the children were split bottom-to-top. For example, nodes A, C, D, and G in tree shown above, which was computed using a 14 as λ and 10 as the maximum number of levels, each correspond to a left-right split of the corresponding sub-rectangle. Nodes B and I each correspond to a bottom-top split. Nodes E, F, H, J, K, L and M are leaves, which means that the corresponding rectangles were not split any further.
Data
Your program will take two CSV files containing the training and testing data. Each line represents a point in 2-dimensions and its binary classification, which will be represented with either 0 (BLUE) or 1 (RED).
Representing Points
The file points.c contains code for representing a single point and a list of points, reading points from a file, and freeing a list of points.
A point contains an x coordinate, y coordinate, and color:
typedef struct point_s {
    double x;
    double y;
    int color;
} *point_t;
A collection of points is represented with a structure that contains the number of points and an array of pointers to points:
typedef struct point_list_s {
    int n;
    point_t *points;
} *point_list_t;

// read_points: read a list of points from a specified file
point_list_t read_points(char *filename);

// free_point_list: free a list of points
void free_point_list(point_list_t pl);
You will use one instance of point_list_t to represent the training data that you will use to create the partitioning and the decision tree and another to represent the testing data that you will use to evaluate the decision tree.
Representing Rectangles
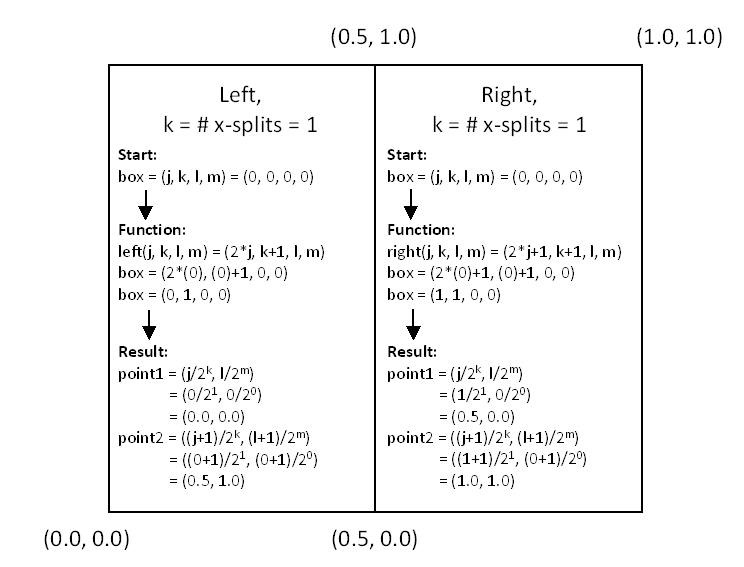
In general, rectangles can be represented by a pair of points. We refer to this representation as the coordinate representation. For example, the unit square can be represented by the coordinates: ((0.0, 0.0), (1.0, 1.0)). For this task, we are going to use a representation, which we refer to as boxes, that is specific to the task. Each box will be represented by four integers \((j, k, l, m)\) that can be translated into a pair of points using the formula: \(((j/2^k,\, l/2^m),\, ((j+1)/2^k,\, (l+1)/2^m))\) . In essence, \(j\) tracks where the box starts in the x-dimension and \(k\) tracks the number of splits in the x-dimension; \(l\) and \(m\) track the same information in the y-dimension.
Here are the formulas for splitting a box:
\begin{align*} left((j,k,l,m)) \,=\, (2*j,\, k+1,\, l,\, m) \\ right((j,\,k,\,l,\,m)) \,=\, (2*j+1,\, k+1,\, l,\, m) \\ bottom((j,\,k,\,l,\,m)) \,=\, (j,\, k,\, 2*l,\, m+1) \\ top((j,\,k,\,l,\,m)) \,=\, (j,\, k,\, 2*l+1,\, m+1) \end{align*}
The following figure illustrates the relationship between the box representation and the coordinate representation:
We have provided code for working with boxes:
typedef int *box_t;

// unit: Create a box for a unit square
box_t unit();

// left/right/bottom/top: create a new box for the
// left/right/bottom/top half of the input box
box_t left(box_t box);
box_t right(box_t box);
box_t bottom(box_t box);
box_t top(box_t box);


// constants for use with coordinates
enum {NUM_COORDINATES=4};
enum {X0=0, Y0=1, X1=2, Y1=3};

// coord: convert box into (x0,y0,x1,y1)
double *coord(box_t box);
Memoization
As discussed in class, the same box can be reached in many ways during the computation. Rather than recompute the cost/optimal partition for a given box many times, you will use a data structure to save and then reuse this information. In particular, your code should check to see if the memo array contains information about the cost and optimal partition for a box before you compute these values. If the information are available, you can just return it directly from your cost/partition function. If not, you should compute it and then store it in the memo array for subsequent use.
A hash table could be used to track the partitions, but we will use a simpler approach that uses a two dimensional array (which we will refer to as "memo array"). If we limit the depth of the tree to a maximum level of \(L\), then it is possible to embed the space of possible boxes in an \(NxN\) array, where \(N\) is \(2^{L+2}\). (Note: the math library contains a function pow(x,y) that computes x raised to the power y.)
We have provided functions in box.c to translate a box into the corresponding row index (x_index) and column index (y_index) in memo array.
We suggest creating a data structure for storing the values that will be stored in the memo array. In our implementation, this data structure includes the corresponding coordinates for the box (for convenience), the cost of the optimal partition, the split dimension (NO_SPLIT, SPLIT_X, SPLIT_Y) for the optimal partition, and a color, which is valid only when the split dimension is NO_SPLIT.
Creating a tree from the memo array
You will need to define a data type for the nodes in your tree. The interior nodes should contain the split dimension, the split value, a left subtree, and a right subtree. The leaves should contain a color. Note that the left and right subtrees should be set to NULL in the leaves.
Once you have the memo array, computing the decision tree is straightforward. The memo array entry for a box B contains the information necessary to construct a tree. If the split dimension is NO_SPLIT, then the tree is just a single leaf. If the split dimension is LEFT_RIGHT, then you can construct the left subtree using the memo array entry for left(B) and the right subtree using the memo array entry for right(B). Similarly, if the split dimension is TOP_BOTTOM, you can construct the left subtree using bottom(B) and the right subtree using top(B).
To construct the decision tree for the unit square, you start with the box for the unit square as B.
Your task
Your task is to write a C program that takes the following arguments:
- the name of a file containing a training data set,
- the name of a file containing a testing data set,
- a value for λ,
- the maximum value for level, and
- a file name for the resulting partition
and compute an optimal dyadic partition and the corresponding classification tree using the training data. Your program should:
Output (to stdout) the accuracy, which is the number of correctly labeled points divided by the total number of points, achieved by your classifier on the testing data.
Write the rectangle represented by each of the leaves in the tree along with its assigned class (1 or 0) to the partition file (the fifth command-line argument). The rectangles should be output using the format:
lbx lby ubx uby class
where (lbx, lby) and (ubx, uby) represent the lower-left and upper-right corners of the rectangle respectively.
For example, here is the expected output for the partition generated using the spiral-training data with a lambda of 14 and a level of 10:
0.0 0.0 0.25 0.5 1
0.25 0.0 0.5 0.25 1
0.25 0.25 0.5 0.5 0
0.0 0.5 0.5 1.0 0
0.5 0.0 0.75 1.0 1
0.75 0.0 0.875 1.0 0
0.875 0.0 1.0 1.0 1
You can decompose this task in a couple of ways. The first approach uses two data structures: one for the memo array and a second for the tree. For this approach, you will need functions to:
- compute the error for a box for a given list of points,
- compute the cost for a box and add information about this box into the memo array. (This function will be called initially with a box corresponding to the unit square, an empty memo array, and a point list containing the training data.)
- construct the tree from the memo array starting with the box corresponding to the unit square,
- generate a partition file from the tree, and
- classify points in a point list containing the testing data set using the tree.
All except the first and, perhaps, the last of these functions will be recursive.
The second approach combines the memo array and the tree into a single data structure and combines steps two and three above into a single step. For this approach, you will need functions to:
- compute the error for a box for a given list of points,
- compute the cost for a box and add information about this box into the memo array/tree. (This function will be called initially with a box corresponding to the unit square, an empty memo array, and a point list containing the training data.)
- generate a partition file from the memo array/tree, and
- classify points in a point list containing the testing data set using the memo array/tree.
All except the first and, perhaps, the last of these functions will be recursive.
Getting Started
We have seeded your repositories with a directory named pa5 that contains:
- dyadic.c: main file
- box.h, box.c: code for representing boxes.
- points.h, points.c: code for representing a list of points.
- util.c, util.h: some basic memory allocation utilities.
- Makefile: a make file.
- view-partition.py: a python program for generating pictures of a partition.
- spiral: a directory containing sample training and testing data from the spiral data set.
The program view-partition.py takes a file in the format shown above for partitions of the unit square and displays an image of the partitions.
Submission
We will be using chisubmit for managing submission, including late chips. See Piazza for instructions regarding how to submit assignments and request late chips.
Acknowledgments John Lafferty suggested using dyadic trees as the basis for this assignment.