
When looking at multiple variables in a dataset, such as the prices of stocks or the number of crimes in a given area, it can be illuminating to compute the correlation between every possible pair of variables. When this data is provided in a time series (where the value of the variables changes over time), the samples for the correlation are taken from an interval of time.
However, this can result in a deluge of numbers that can be difficult to make sense of. A useful way of visualizing this information is as a heat map, where positively correlated variables are "hot" and negatively correlated variables are "cold". For example, this heat map shows the correlations between 49 stocks, sampling the five days following the downgrade of the US's credit rating in early August 2011:
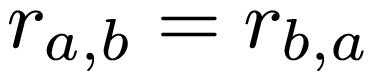
As you can see, all stocks are positively correlated with each other, except gold, which is negatively correlated with every other stock.
In this assignment, we will give you two datasets (historical stock data and crime data from the City of Chicago), and you will compute the correlation between various variables during an interval of time. We provide a visualizer that will generate a heat map like the one above, assuming you correctly implement the functions that compute the correlation between variables.
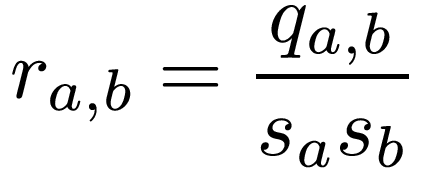
With N sample measurements, the sample covariance is defined thusly:
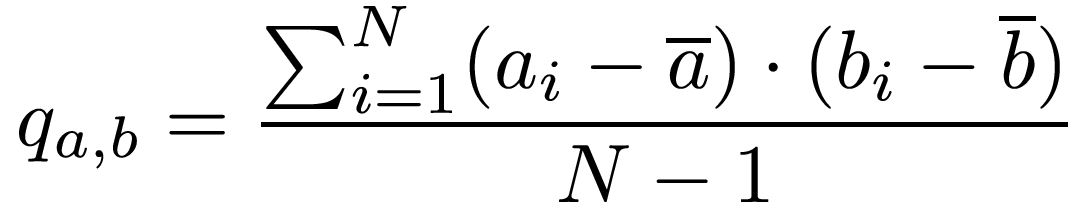
Where ai and bi are the individual measurements, and a and b are the means of the measurements.
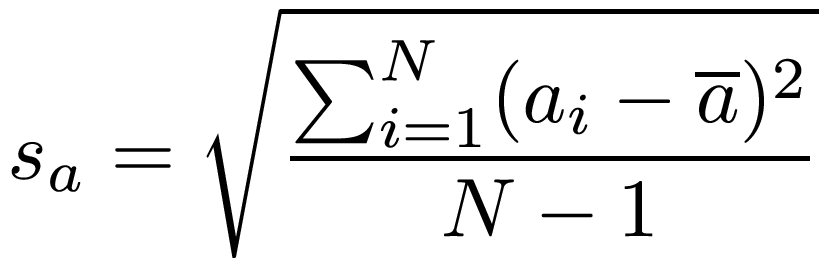
The sample standard deviation is defined thusly:
Computing a time series correlation
To compute correlations in time series data, the measurements we include in the sample are determined by a time interval. We will specify this interval using two values: the first day in the interval, and the number of days in the interval (including that first day). In one of the datasets we provide, there is already a single piece of data per day, whereas the other contains multiple pieces of data per day, which you will need to aggregate into a single piece of data per day.
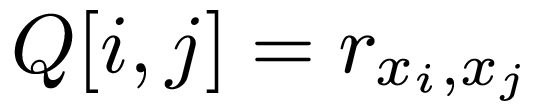
Generating a correlation matrix
The correlation matrix of M variables (x1, x2, ... , xM) is an M x M matrix, where each entry of the matrix is defined as follows:
Dataset 1: Historical stock data
This dataset is a directory with one CSV file per stock. The name of each file is symbol.csv. So, for example, the file with the data for Google is GOOG.csv. Each file looks like this:
Date,Open,High,Low,Close,Volume,Adj Close
2010-11-09,17.22,17.60,16.86,16.97,56218900,16.97
2010-11-10,17.00,17.01,16.75,16.94,17012600,16.94
2010-11-11,16.63,16.86,16.52,16.80,15310600,16.80
2010-11-12,16.65,16.75,16.40,16.55,17703400,16.55
2010-11-15,16.56,16.89,16.33,16.60,18934600,16.60
2010-11-16,16.45,16.49,16.10,16.24,23484100,16.24
2010-11-17,16.21,16.33,16.11,16.15,10305800,16.15
2010-11-18,16.40,17.17,16.29,16.99,46500100,16.99
2010-11-19,16.97,16.97,16.52,16.57,24036200,16.57
For each date, the following information is provided:
Additionally, the directory also contains a file called variables.txt with the list of symbols (one per line) that should be included in the correlation matrix (and in the same order as the would appear in the matrix). The purpose of this file is to allow you to work with smaller sets of stocks, and the order in which they appear in the matrix, without having to remove or move the stock files around.
You may assume that, for a given directory with stock data files, all the files contain the same number of entries and for the same dates. In fact, you are not expected to work with the dates directly; instead, you can simply consider the first entry in the file to be "day 0", the second entry to be "day 1", etc. For the purposes of this assignment, you are dealing with a sequence of T days. You should not need to use Python's datetime data type for this assignment.
To compute the correlation between stocks, you will need to compute a new piece of data based on the data contained in the dataset. More specifically, we will want to see the correlation between the returns of each stock. The raw return of a stock on day i is simply:
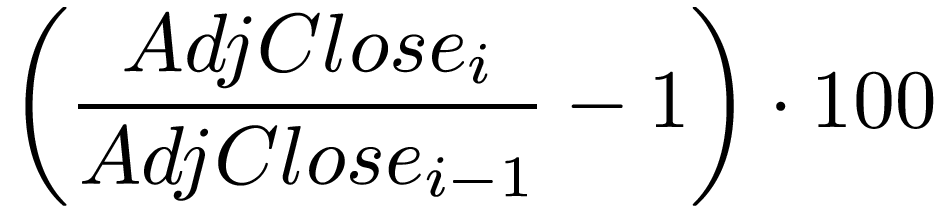
However, we will use the log return instead:

Notice that, when reading in this dataset, you should discard the entry for day 0, as we cannot compute the log return for it (but it will be necessary to compute the log return for day 1).
Dataset 2: City of Chicago data
This dataset contains information on several types of events (311 calls, reported crimes, etc.). Like the stock dataset, this dataset is a directory with multiple CSV files (in this case, one file per type of event). The city data is quite large, so we have elided many of the fields. For example, here are the first few lines from the file ASSAULT.csv:
CREATION DATE, LATITUDE, LONGITUDE
01/01/2011,41.69086778069725,-87.62431771445297
01/01/2011,41.815175023517334,-87.66622787195554
01/01/2011,41.675309884758434,-87.62873824037594
01/01/2011,41.97422126077659,-87.65147882822946
01/01/2011,41.764133641959404,-87.68826950986085
Each line represents an event and the following information is provided:
The lines are sorted by date, with the earliest date first, and there is at least one report/request for each day.
To compute the correlation between events, you will need to compute a new piece of data based on the data contained in the dataset. More specifically, we will want to see the correlation between the number of events of each kind per day.
Like the stock dataset, the directory contains a variables.txt file with the list of events (one per line) that should be included in the correlation matrix (and in the same order as the would appear in the matrix). You should also regard the dataset as specifying a sequence of T days. In this dataset, 01/01/2011 is day 0, 01/02/2011 is day 1, etc. You do not need to use Python's datetime data type for this assignment.
In this assignment, we are providing you with code that will produce a correlation matrix visualization like the one shown at the beginning of this document. This code assumes that you have implemented a series of functions that read in the data and compute the correlation matrix. Your task will be to implement those functions.
def read_data_from_dir(path, variables)
This function reads in a dataset (either the stocks dataset or the city dataset, as described above) . It takes two parameters:
The return type is up to you. However, take into account that our code uses whatever you return in this function to call two other functions below.
Since reading in a dataset involves reading multiple CSV files, we recommend you add an auxiliary function that reads in a single CSV file.
def get_number_of_days(dataset)
This function takes in the dataset, as returned by your implementation read_data_from_dir, and returns the number of days in the dataset
def compute_correlation_matrix(dataset, variables, interval_start, interval_length)
This function computes the correlation matrix between several variables during a given time period. It takes four parameters:
This function returns the correlation matrix as a list of lists. More specifically, if the number of variables in the variables list is N, then this function must return a list of size N, where each element is a list of N floats (i.e., essentially a 2D array represented as lists). The (i,j) position is the correlation between the variable named variables[i] and the variable named variables[j].
def compute_correlation(datalist1, datalist2, interval_start, interval_length)
This is an auxiliary function that you must call from compute_correlation_matrix. It computes the correlation between two variables during a given time period. It takes four parameters:
The function must return a floating point number with the correlation (r, as described earlier) between the specified variables during the specified interval.
Do not modify any of these files. Your work should be constrained to either the stocks.py file or the city.py file. We have provided barebones versions of these two files, containing only the function declarations.
Once you implement stocks.py or city.py, you can run the visualizer like this:
python visualizer.py (stock|city) <data-directory>
Where the first parameter must be either stock or city, depending on the type of data you're working with, and <data-directory> is a directory containing the data.
Make sure your name and CNET ID are at the top of either stocks.py or city.py and then check your code into PhoenixForge.
We strongly recommend that you check your code into PhoenixForge at regular intervals!